

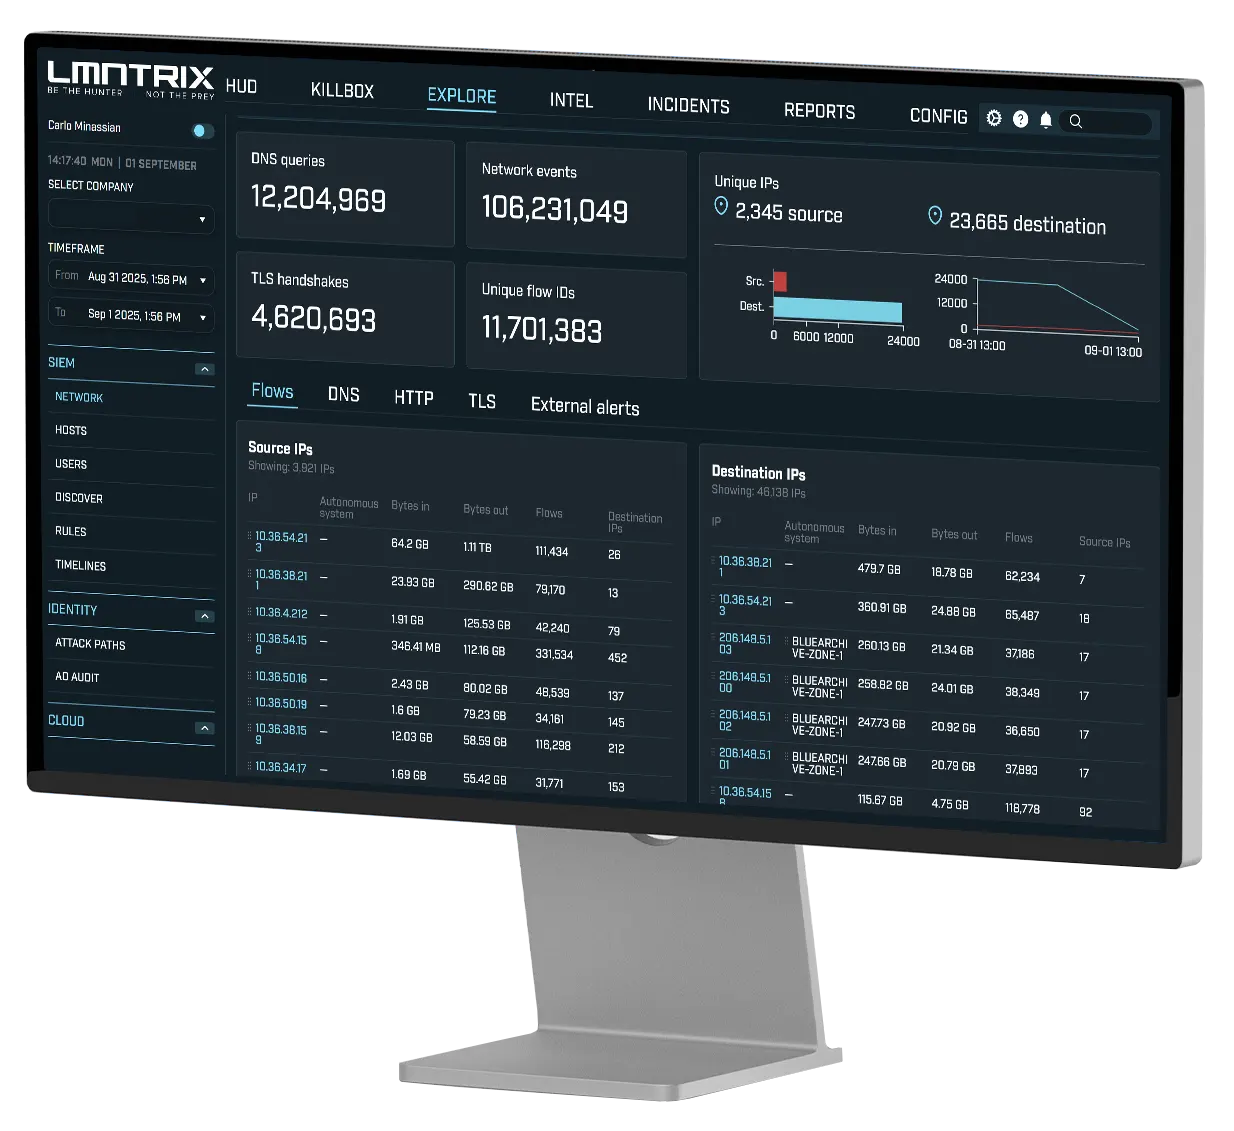
What is LMNTRIX Packets?
How does LMNTRIX Packets work?
What are the consumption options for LMNTRIX Packets?
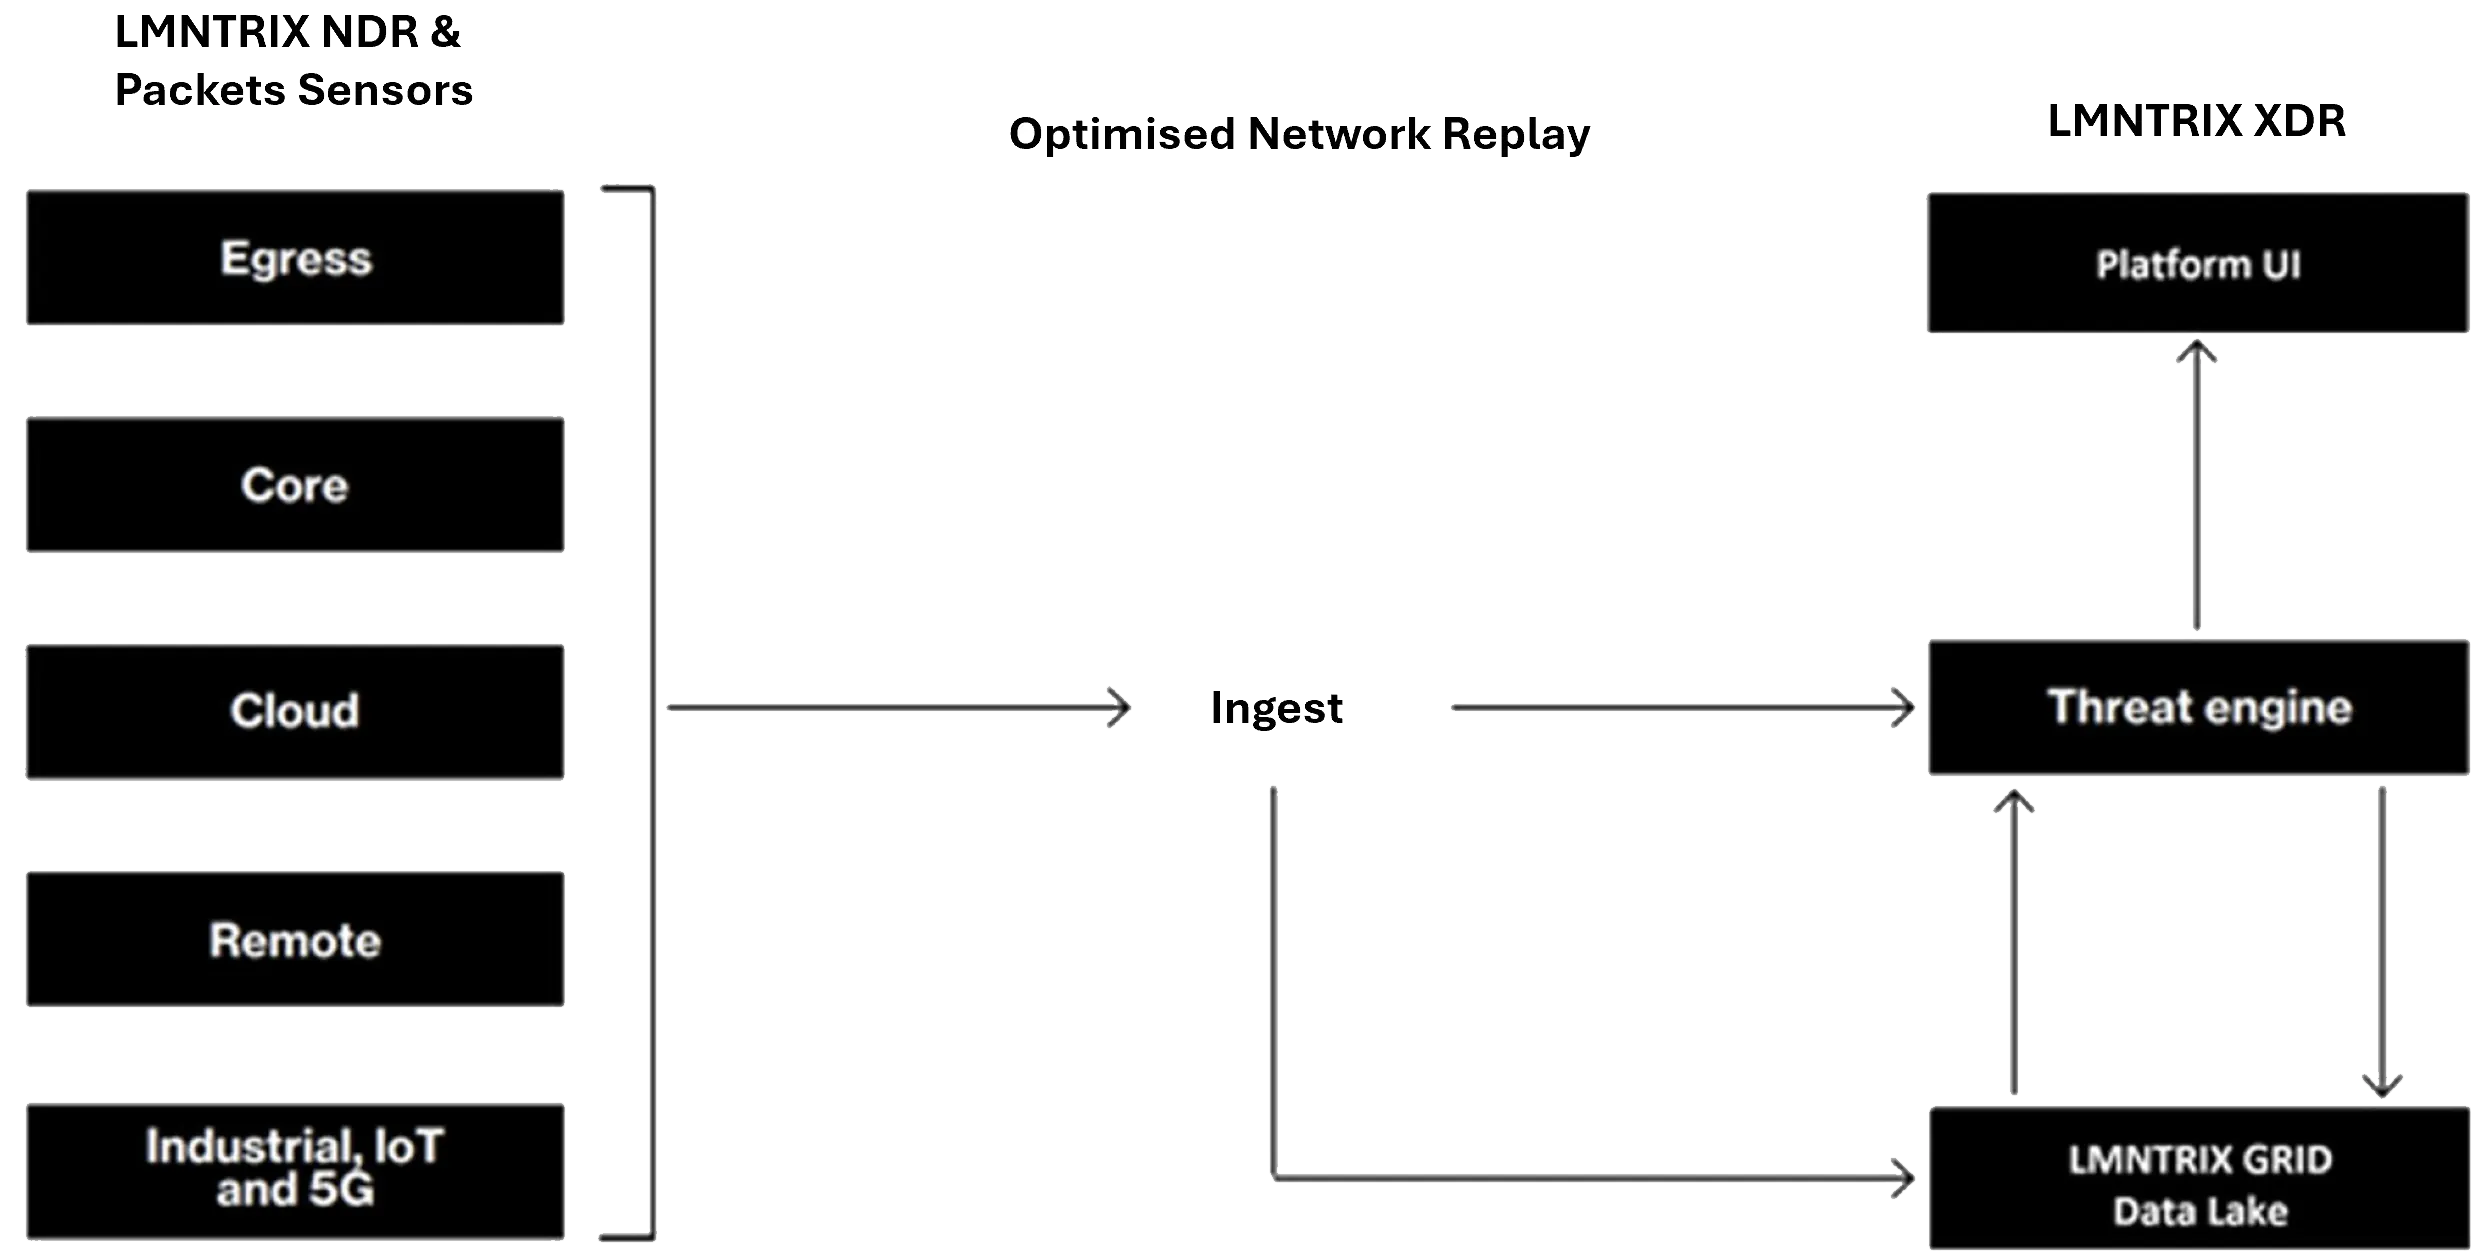
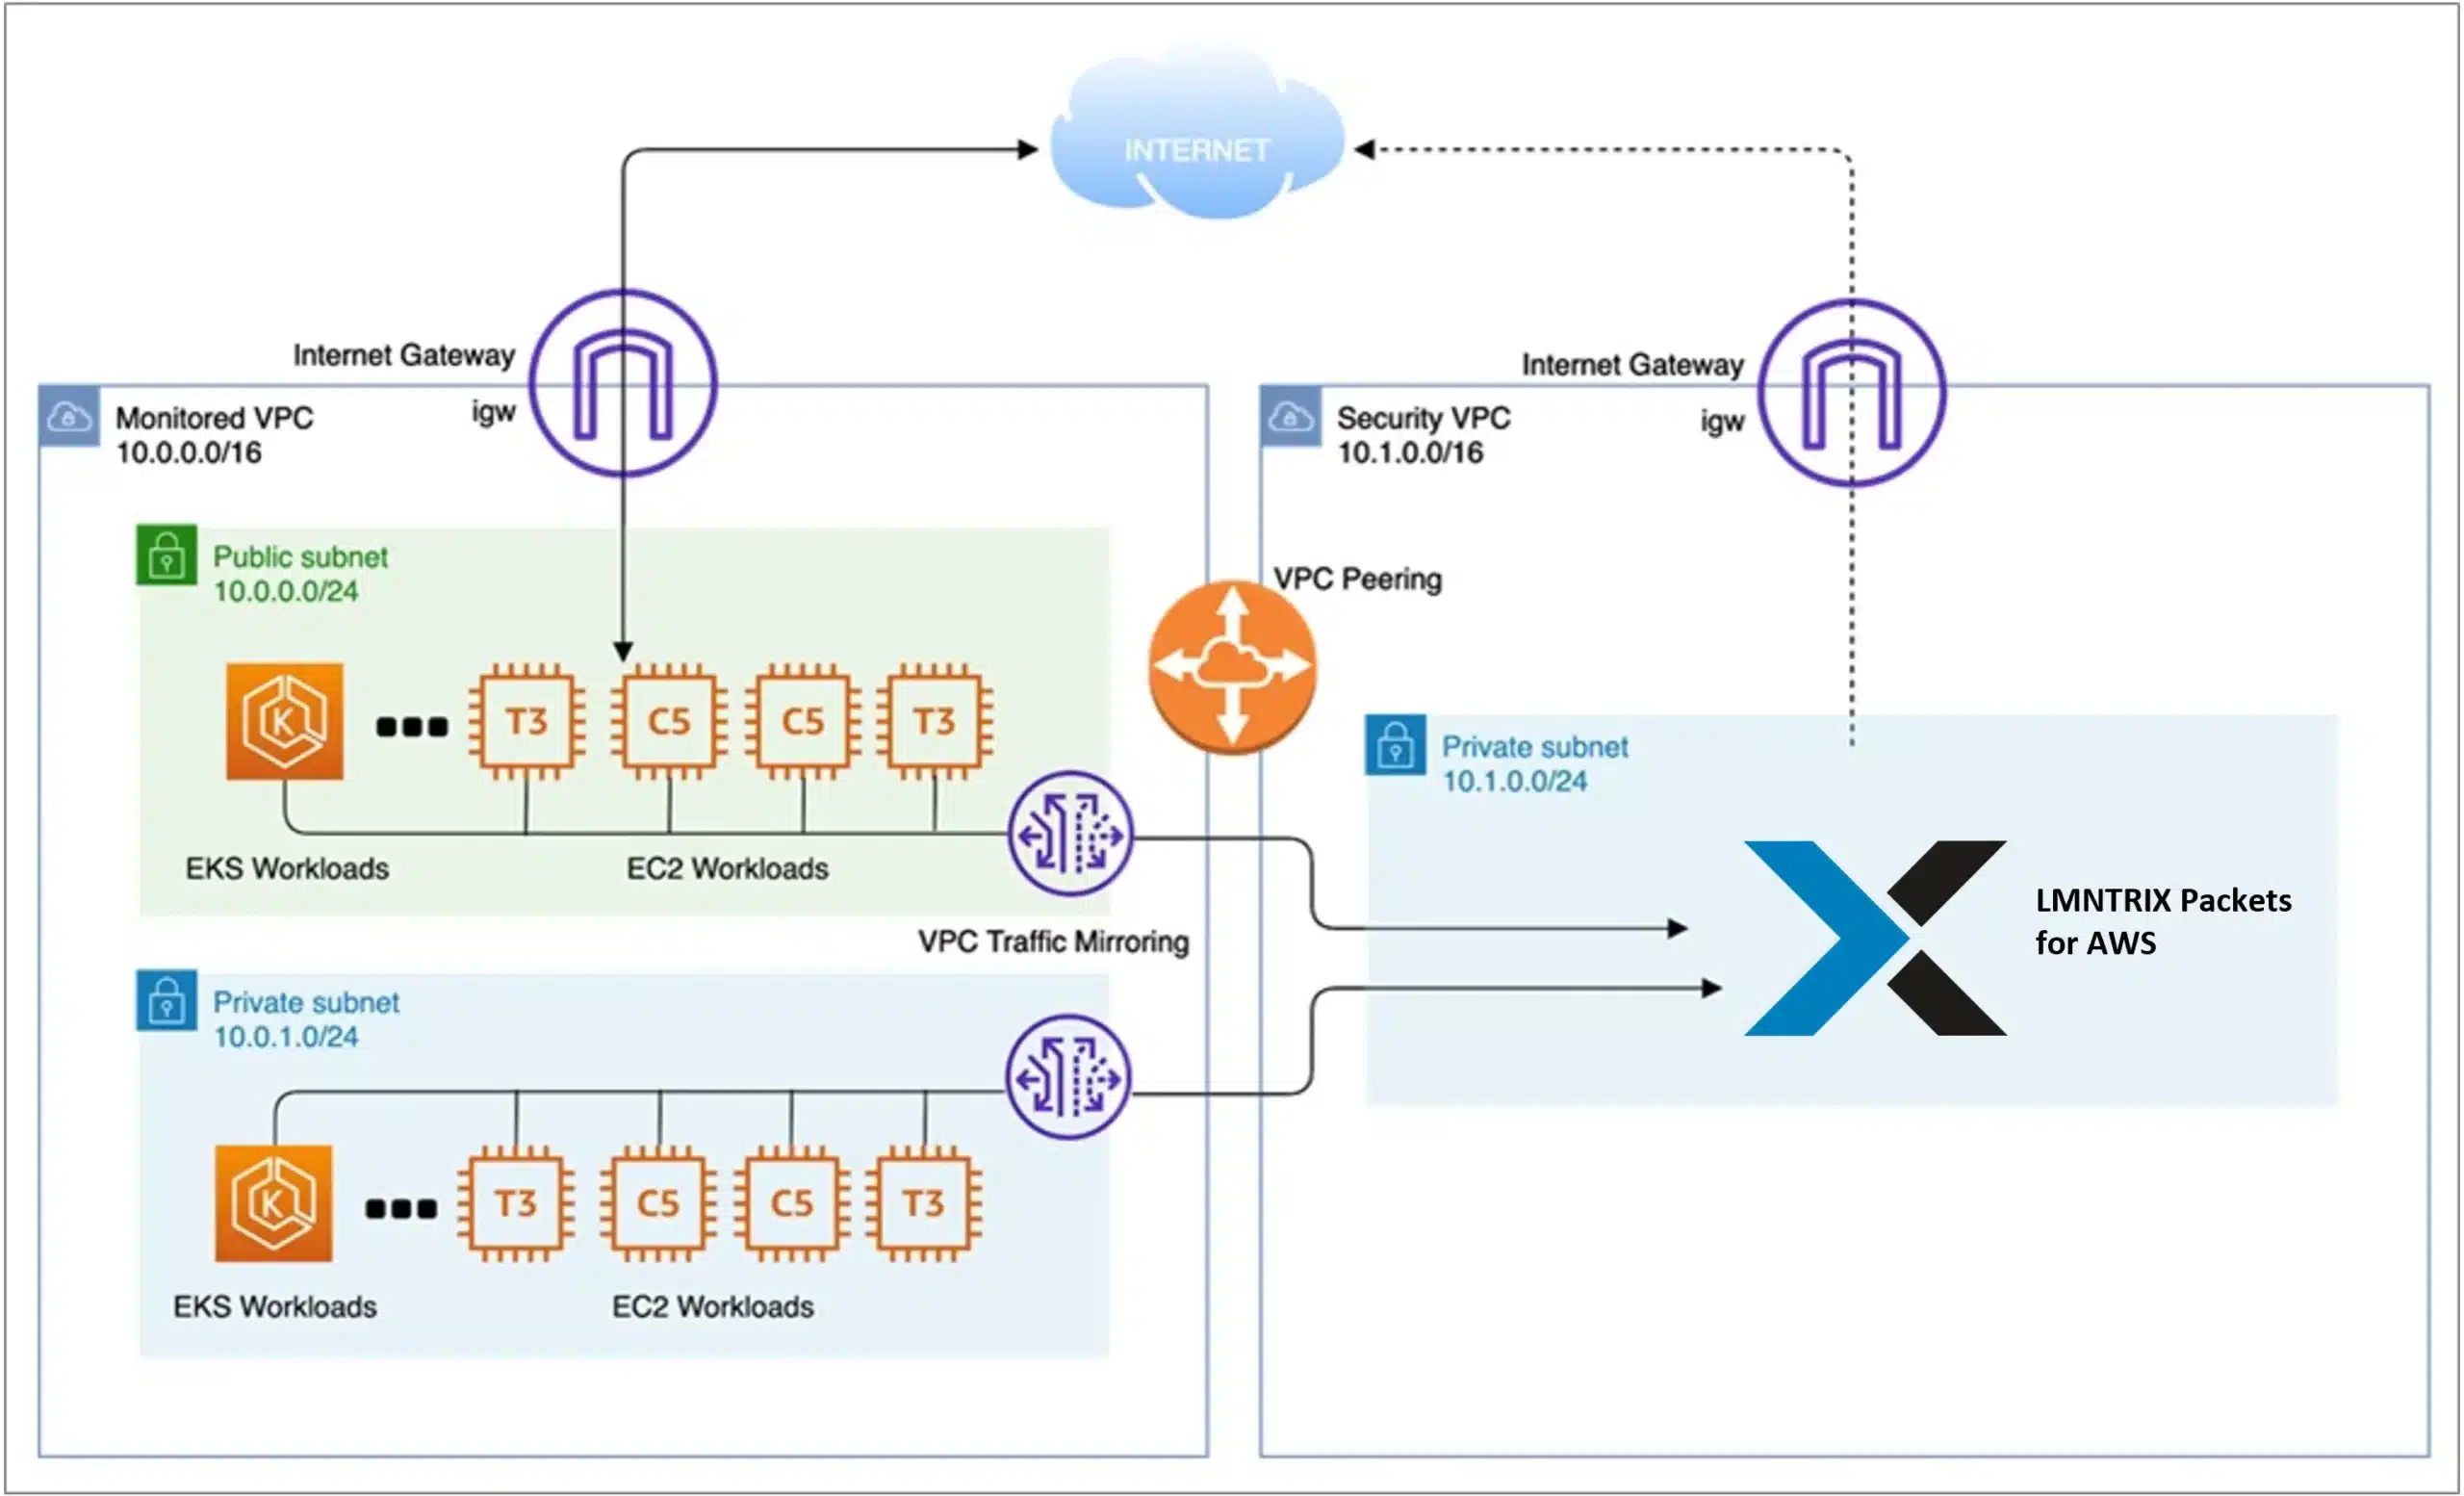
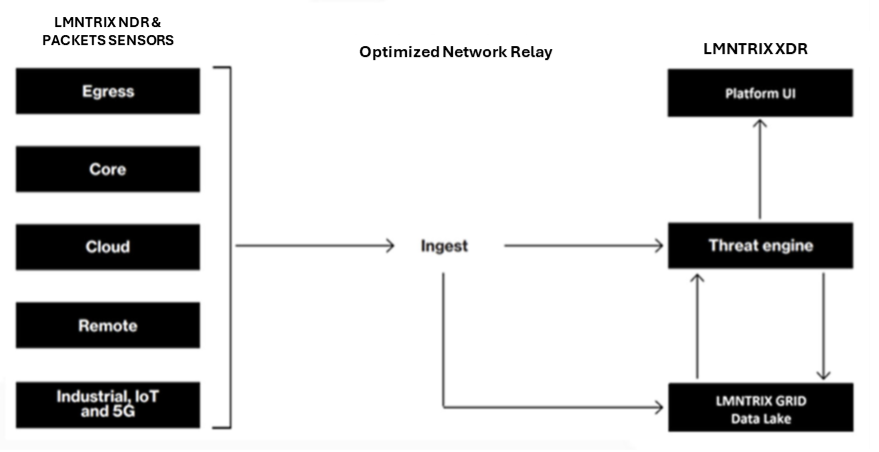
What is the LMNTRIX Packets sensor deployment architecture?

Are there any best practice LMNTRIX Packets sensor placement strategies?
What are the LMNTRIX Packets sensor hardware requirements?
How does a LMNTRIX Packets sensor communicate with LMNTRIX XDR?
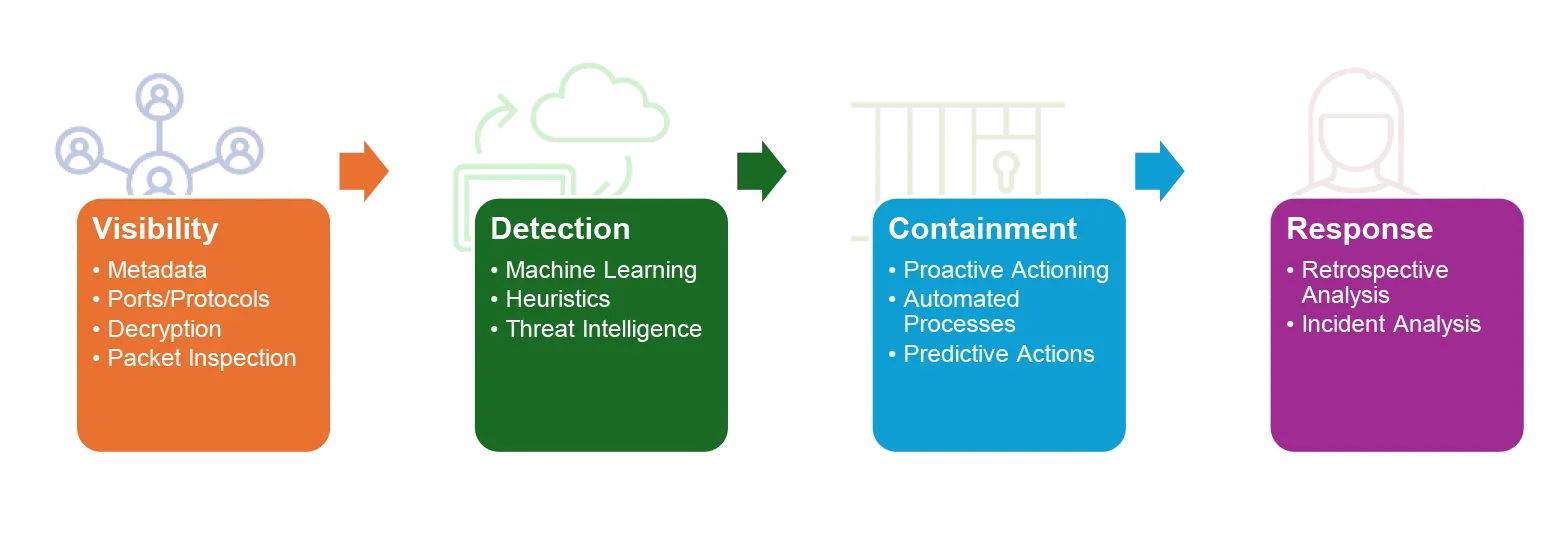
How are encrypted threats detected with LMNTRIX Packets?
What are LMNTRIX responsibilities during Packets onboarding?
What are Client responsibilities during Packets onboarding?


I couldn't believe the level of detail during testing using an unannounced red team. In real-time, LMNTRIX analysts were baiting attackers and actively pursuing them in our environment-it was like something out of a movie.

Matt Kraus
IT Manager, Alliance Funding Group
LMNTRIX XDR didn't just do one thing; it covered all the bases: endpoint, network, cloud, mobile, identity, moving target defense and proactive threat hunting. To build this ourselves, we'd need 50 different products, and then we'd need to find security analysts capable of managing them all. The hyper-converged and holistic approach that LMNTRIX takes is a real game changer in my opinion.

Kim Green
CISO, World Market
I appreciate that working with the LMNTRIX team feels collaborative, and they leverage their extensive knowledge of current trends and attack techniques to guide us effectively. With our small team, we lack the resources to constantly research emerging threats—LMNTRIX fills that gap, providing us with vital information that helps us prioritize and refine our security strategy.

Shaun Hay
Group Manager Technology and Systems
LMNTRIX seamlessly integrates with our team, making their analysts an extension of our own resources. Their deep understanding of our environment allows my internal team to focus on other essential security initiatives that drive Dentons' success.

Victor Yeo
Head of Information Security
Our approach to detection is something we take seriously. While many MDR companies can set up a SOC and connect with various technologies to pass on alerts, LMNTRIX stands out by providing the critical context we need. They bridge the gap between us and our tools, delivering insights that truly matter. It's like LMNTRIX is playing chess, while others are just playing checkers.

Eduard Pieters
Chief Information Officer
LMNTRIX stood out in our evaluation as the sole provider that developed its own sophisticated cloud detections instead of merely relying on GuardDuty as an intermediary. Unlike other vendors who claimed capability in managing our cloud alerts, LMNTRIX was the only one that substantiated its capabilities.

Integrating our SIEM with the LMNTRIX XDR platform has provided a more comprehensive view of our security events and alerts across Microsoft 365, Defender, and Azure Active Directory. This integration facilitates quicker and more precise incident responses. The streamlined workflows and reduced manual processes have freed up valuable time, allowing us to address additional security priorities.
John Smith
Director of Cybersecurity and Incident Response